Strength is Still the Story at HOMB with Another Record Breaking Quarter
CONWAY, Ark., Oct. 15, 2025 (GLOBE NEWSWIRE) -- Home BancShares, Inc. (NYSE: HOMB) (“Home” or the “Company”), parent company of Centennial Bank, released quarterly earnings today.
| Quarterly Highlights | |||||
| Metric | Q3 2025 | Q2 2025 | Q1 2025 | Q4 2024 | Q3 2024 |
| Net income | $123.6 million | $118.4 million | $115.2 million | $100.6 million | $100.0 million |
| Net income, as adjusted (non-GAAP)(1) | $119.7 million | $114.6 million | $111.9 million | $99.8 million | $99.0 million |
| Total revenue (net) | $277.7 million | $271.0 million | $260.1 million | $258.4 million | $258.0 million |
| Income before income taxes | $159.3 million | $152.0 million | $147.2 million | $129.5 million | $129.1 million |
| Pre-tax, pre-provision, net income (PPNR) (non-GAAP)(1) | $162.8 million | $155.0 million | $147.2 million | $146.2 million | $148.0 million |
| PPNR, as adjusted (non-GAAP)(1) | $157.7 million | $150.4 million | $142.8 million | $145.2 million | $146.6 million |
| Pre-tax net income to total revenue (net) | 57.38% | 56.08% | 56.58% | 50.11% | 50.03% |
| Pre-tax net income, as adjusted, to total revenue (net) (non-GAAP)(1) | 55.53% | 54.39% | 54.91% | 49.74% | 49.49% |
| P5NR (Pre-tax, pre-provision, profit percentage) (PPNR to total revenue (net)) (non-GAAP)(1) | 58.64% | 57.19% | 56.58% | 56.57% | 57.35% |
| P5NR, as adjusted (non-GAAP)(1) | 56.80% | 55.49% | 54.91% | 56.20% | 56.81% |
| ROA | 2.17% | 2.08% | 2.07% | 1.77% | 1.74% |
| ROA, as adjusted (non-GAAP)(1) | 2.10% | 2.02% | 2.01% | 1.76% | 1.72% |
| NIM | 4.56% | 4.44% | 4.44% | 4.39% | 4.28% |
| Purchase accounting accretion | $1.3 million | $1.2 million | $1.4 million | $1.6 million | $1.9 million |
| ROE | 11.91% | 11.77% | 11.75% | 10.13% | 10.23% |
| ROE, as adjusted (non-GAAP)(1) | 11.54% | 11.39% | 11.41% | 10.05% | 10.12% |
| ROTCE (non-GAAP)(1) | 18.28% | 18.26% | 18.39% | 15.94% | 16.26% |
| ROTCE, as adjusted (non-GAAP)(1) | 17.70% | 17.68% | 17.87% | 15.82% | 16.09% |
| Diluted earnings per share | $0.63 | $0.60 | $0.58 | $0.51 | $0.50 |
| Diluted earnings per share, as adjusted (non-GAAP)(1) | $0.61 | $0.58 | $0.56 | $0.50 | $0.50 |
| Non-performing assets to total assets | 0.56% | 0.60% | 0.56% | 0.63% | 0.63% |
| Common equity tier 1 capital | 16.1% | 15.6% | 15.4% | 15.1% | 14.7% |
| Leverage | 13.8% | 13.4% | 13.3% | 13.0% | 12.5% |
| Tier 1 capital | 16.1% | 15.6% | 15.4% | 15.1% | 14.7% |
| Total risk-based capital | 18.9% | 19.3% | 19.1% | 18.7% | 18.3% |
| Allowance for credit losses to total loans | 1.87% | 1.86% | 1.87% | 1.87% | 2.11% |
| Book value per share | $21.41 | $20.71 | $20.40 | $19.92 | $19.91 |
| Tangible book value per share (non-GAAP)(1) | $14.13 | $13.44 | $13.15 | $12.68 | $12.67 |
| Dividends per share | $0.20 | $0.20 | $0.195 | $0.195 | $0.195 |
| Shareholder buyback yield(2) | 0.18% | 0.49% | 0.53% | 0.05% | 0.56% |
(1) Calculation of this metric and the reconciliation to GAAP are included in the schedules accompanying this release.
(2) Calculation of this metric is included in the schedules accompanying this release.
“HOMB’s powerful, peer leading margins and efficiencies, coupled with strong revenues, propelled HOMB to another top tier, best in class third quarter performance,” said John Allison, Chairman.
Financial Performance Trends
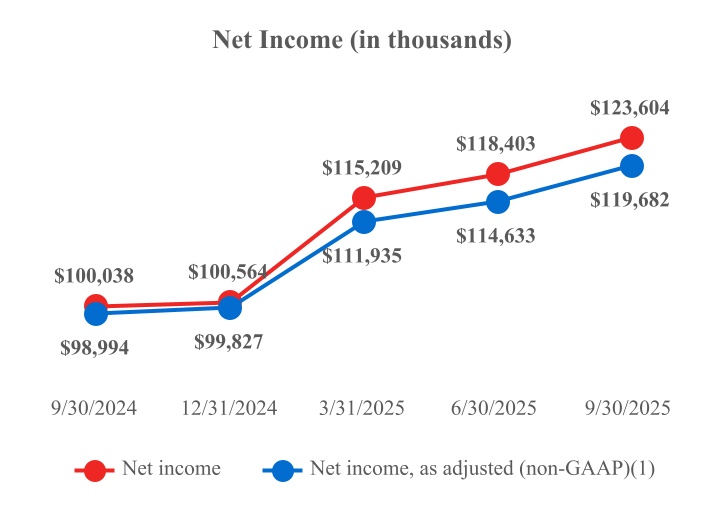
The chart below illustrates Home BancShares’ consistent improvement in profitability over the past five quarters. Net income reached a record $123.6 million in Q3 2025, while net income, as adjusted (non-GAAP)(1), also set a new high at $119.7 million. This sustained upward trend reflects the Company’s strong operational performance and effective management of one-time expenses.
The chart below demonstrates Home BancShares’ robust operational performance as measured by pre-tax, pre-provision, net income (PPNR) (non-GAAP)(1) over the past five quarters. PPNR is a key indicator of the Company’s earnings power, as it reflects revenue generation and expense management before the impact of credit loss provisions and taxes.
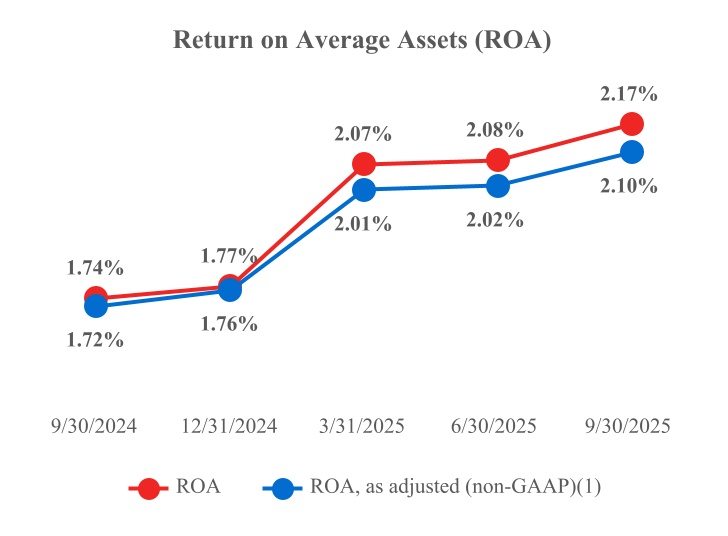
 The chart below highlights Home BancShares’ strong and consistent return on average assets (ROA) over the past five quarters. ROA, a key measure of how efficiently the Company utilizes its assets to generate net income, has demonstrated a steady upward trend, reaching 2.17% in Q3 2025. This improvement reflects the Company’s disciplined approach to asset management, prudent lending practices, and ongoing focus on operational efficiency.
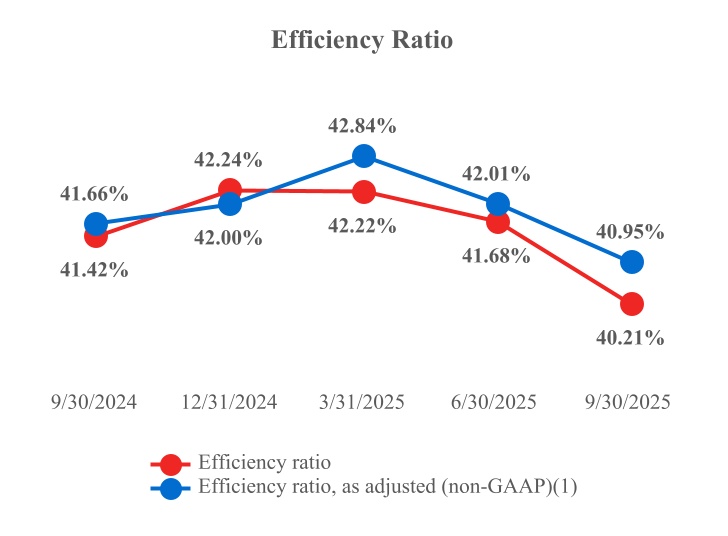
The chart below underscores Home BancShares’ strong and consistent performance in managing operating expenses, as reflected in its efficiency ratio over the past five quarters. The efficiency ratio is a key metric that measures how effectively the Company converts its revenue into net income by comparing non-interest expenses to total revenue. A lower efficiency ratio indicates greater operational efficiency and cost discipline, which are essential for sustaining profitability and enhancing shareholder value.
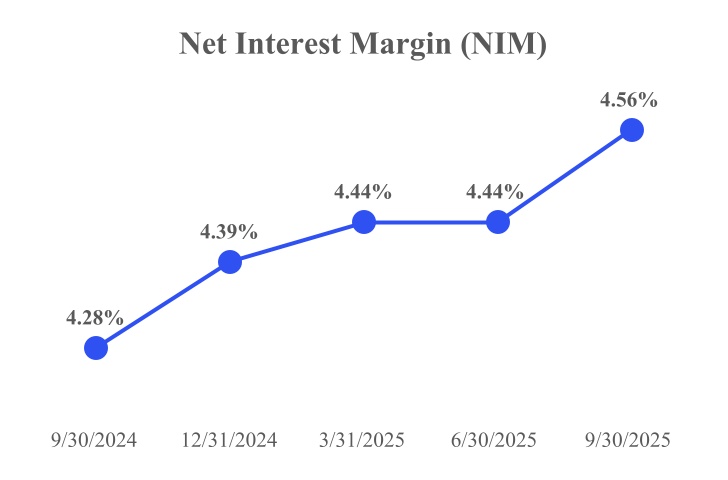
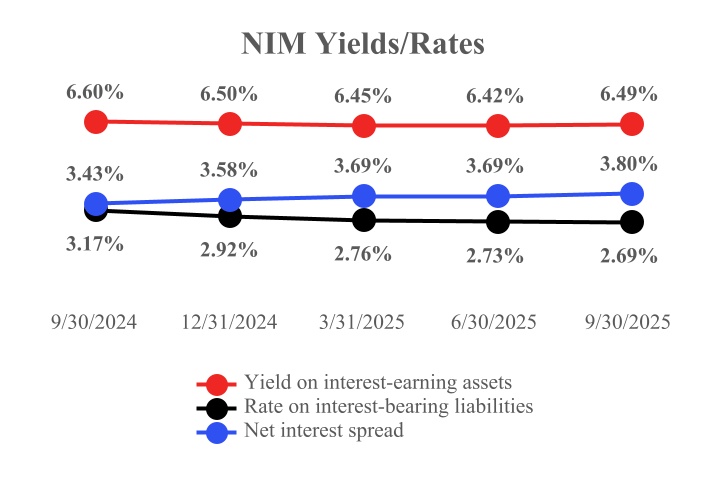
The tables below present additional key financial metrics over the past five quarters, including net interest margin (NIM), yield on interest-earning assets, rate on interest-bearing liabilities, and net interest spread. These metrics are fundamental indicators of the Company’s profitability and operational efficiency.
Operating Highlights
Net income for the three-month period ended September 30, 2025 was $123.6 million, or $0.63 diluted earnings per share, both of which were records for the Company. When adjusting for non-fundamental items, net income and diluted earnings per share on an as-adjusted basis (non-GAAP), were $119.7 million(1) and $0.61 per share(1), respectively, for the three months ended September 30, 2025.
The Company recorded $6.7 million in provision for credit losses on loans during the three-month period ended September 30, 2025. In addition, the Company recorded a $1.0 million recovery of credit losses on unfunded commitments. The Company also recorded a $2.2 million recovery of credit losses on investment securities. As a result, total credit loss expense for the three-month period ended September 30, 2025 was $3.5 million.
Our net interest margin was 4.56% and 4.44% for the three-month periods ended September 30, 2025 and June 30, 2025, respectively. The yield on loans was 7.39% and 7.36% for the three months ended September 30, 2025 and June 30, 2025, respectively, as average loans increased from $15.06 billion to $15.22 billion. Additionally, the rate on interest bearing deposits decreased to 2.62% as of September 30, 2025, from 2.64% as of June 30, 2025, while average interest-bearing deposits decreased from $13.43 billion to $13.32 billion.
During the third quarter of 2025, there was $1.5 million of event interest income compared to $516,000 of event interest income for the second quarter of 2025. Purchase accounting accretion on acquired loans was $1.3 million and $1.2 million for the three-month periods ended September 30, 2025 and June 30, 2025, respectively, and average purchase accounting loan discounts were $15.0 million and $16.2 million for the three-month periods ended September 30, 2025 and June 30, 2025, respectively.
Net interest income on a fully taxable equivalent basis was $229.1 million for the three-month period ended September 30, 2025, and $222.5 million for the three-month period ended June 30, 2025. This increase in net interest income for the three-month period ended September 30, 2025, was the result of a $4.8 million increase in interest income, and a $1.8 million decrease in interest expense. The $4.8 million increase in interest income was primarily the result of a $7.5 million increase in loan income. This was partially offset by a $2.7 million decrease in income from deposits with other banks. The $1.8 million decrease in interest expense was due to a $1.1 million decrease in interest expense on subordinated debt and a $527,000 decrease in interest expense on deposits. The $1.1 million decrease in interest expense on subordinated debt was a result of the Company repurchasing $20.0 million in par value of its $300.0 million Fixed-to-Floating Rate Subordinated Notes due 2032.
The Company reported $51.5 million of non-interest income for the third quarter of 2025. The most important components of non-interest income were $14.0 million from other income, $12.1 million from other service charges and fees, $10.5 million from service charges on deposit accounts, $4.7 million in mortgage lending income, $4.6 million from trust fees, $2.7 million from dividends from FHLB, FRB, FNBB and other, $1.4 million from the increase in cash value of life insurance and $1.0 million from the fair value adjustment for marketable securities. Included within other income were $2.0 million income from recoveries on historic losses, $1.9 million income from the gain on the retirement of subordinated debt, $1.8 million income from a recovery on a lawsuit and $187,000 in bank owned life insurance death benefit income.
Non-interest expense for the third quarter of 2025 was $114.8 million. The most important components of non-interest expense were $63.8 million salaries and employee benefits expense, $27.3 million in other operating expense, $14.8 million in occupancy and equipment expenses and $8.9 million in data processing expenses. For the third quarter of 2025, our efficiency ratio was 40.21%, and our efficiency ratio, as adjusted (non-GAAP), was 40.95%(1).
Financial Condition
Total loans receivable were $15.29 billion at September 30, 2025, compared to $15.18 billion at June 30, 2025. Total loans receivable of $15.29 billion were a record for the Company. Total deposits were $17.33 billion at September 30, 2025, compared to $17.49 billion at June 30, 2025. Total assets were $22.71 billion at September 30, 2025, compared to $22.91 billion at June 30, 2025.
During the third quarter of 2025, the Company had a $105.3 million increase in loans. Our community banking footprint experienced $164.8 million in organic loan growth during the quarter ended September 30, 2025, and Centennial CFG experienced $59.4 million of organic loan decline and had loans of $1.78 billion at September 30, 2025.
Non-performing loans to total loans were 0.56% and 0.63% at September 30, 2025 and June 30, 2025, respectively. Non-performing assets to total assets were 0.56% and 0.60% at September 30, 2025 and June 30, 2025, respectively. Net loans charged-off were $2.9 million and $1.1 million for the three months ended September 30, 2025 and June 30, 2025, respectively. The charge-off detail by region for the quarters ended September 30, 2025 and June 30, 2025 can be seen below.
| For the Three Months Ended September 30, 2025 | |||||||||||||||||||||||||||
| (in thousands) | Texas | Arkansas | Centennial CFG |
Shore Premier Finance |
Florida | Alabama | Total | ||||||||||||||||||||
| Charge-offs | $ | 2,496 | $ | 605 | $ | — | $ | 735 | $ | 807 | $ | 8 | $ | 4,651 | |||||||||||||
| Recoveries | (1,451 | ) | (225 | ) | — | (5 | ) | (47 | ) | (3 | ) | (1,731 | ) | ||||||||||||||
| Net charge-offs (recoveries) | $ | 1,045 | $ | 380 | $ | — | $ | 730 | $ | 760 | $ | 5 | $ | 2,920 | |||||||||||||
| For the Three Months Ended June 30, 2025 | |||||||||||||||||||||||||||
| (in thousands) | Texas | Arkansas | Centennial CFG |
Shore Premier Finance |
Florida | Alabama | Total | ||||||||||||||||||||
| Charge-offs | $ | 2,588 | $ | 462 | $ | 181 | $ | 582 | $ | 245 | $ | 13 | $ | 4,071 | |||||||||||||
| Recoveries | (2,172 | ) | (223 | ) | — | (22 | ) | (577 | ) | (2 | ) | (2,996 | ) | ||||||||||||||
| Net (recoveries) charge-offs | $ | 416 | $ | 239 | $ | 181 | $ | 560 | $ | (332 | ) | $ | 11 | $ | 1,075 | ||||||||||||
At September 30, 2025, non-performing loans were $85.2 million, and non-performing assets were $126.5 million. At June 30, 2025, non-performing loans were $96.3 million, and non-performing assets were $137.8 million.
The table below shows the non-performing loans and non-performing assets by region as of September 30, 2025:
| (in thousands) | Texas | Arkansas | Centennial CFG |
Shore Premier Finance |
Florida | Alabama | Total | |||||||
| Non-accrual loans | 25,701 | 19,102 | 787 | 10,472 | 24,867 | 158 | 81,087 | |||||||
| Loans 90+ days past due | 3,167 | 704 | — | — | 254 | — | 4,125 | |||||||
| Total non-performing loans | 28,868 | 19,806 | 787 | 10,472 | 25,121 | 158 | 85,212 | |||||||
| Foreclosed assets held for sale | 16,711 | 972 | 22,812 | — | 768 | — | 41,263 | |||||||
| Total other non-performing assets | 16,711 | 972 | 22,812 | — | 768 | — | 41,263 | |||||||
| Total non-performing assets | 45,579 | 20,778 | 23,599 | 10,472 | 25,889 | 158 | 126,475 |
The table below shows the non-performing loans and non-performing assets by region as June 30, 2025:
| (in thousands) | Texas | Arkansas | Centennial CFG |
Shore Premier Finance |
Florida | Alabama | Total | |||||||
| Non-accrual loans | 22,487 | 16,276 | 787 | 11,716 | 37,833 | 162 | 89,261 | |||||||
| Loans 90+ days past due | 3,557 | 2,341 | — | — | 1,133 | — | 7,031 | |||||||
| Total non-performing loans | 26,044 | 18,617 | 787 | 11,716 | 38,966 | 162 | 96,292 | |||||||
| Foreclosed assets held for sale | 17,259 | 863 | 22,842 | — | 565 | — | 41,529 | |||||||
| Total other non-performing assets | 17,259 | 863 | 22,842 | — | 565 | — | 41,529 | |||||||
| Total non-performing assets | 43,303 | 19,480 | 23,629 | 11,716 | 39,531 | 162 | 137,821 |
The Company’s allowance for credit losses on loans was $285.6 million at September 30, 2025, or 1.87% of total loans, compared to the allowance for credit losses on loans of $281.9 million, or 1.86% of total loans, at June 30, 2025. As of September 30, 2025 and June 30, 2025, the Company’s allowance for credit losses on loans was 335.22% and 292.72% of its total non-performing loans, respectively.
During the third quarter of 2025, the Company completed the payoff of its $140.0 million 5.50% Fixed-to-Floating Rate Subordinated Notes due 2030. Each 2030 Note was redeemed at the redemption price of 100% of its principal amount, plus accrued and unpaid interest. In addition, the Company also repurchased $20.0 million of its $300.0 million Fixed-to-Floating Rate Subordinated Notes due 2032. The payoff and redemption activity had a negative impact to the Company’s total risk-based capital ratio of 87 basis points, including 76 basis points from the payoff of the 2030 Notes and 11 basis points from the partial redemption of the 2032 Notes.
Shareholders’ equity was $4.21 billion at September 30, 2025, which increased approximately $129.6 million from June 30, 2025. The net increase in shareholders’ equity is primarily associated with the $84.2 million increase in retained earnings and the $52.8 million decrease in accumulated other comprehensive loss. This was partially offset by the $9.9 million in stock repurchases for the quarter. Book value per common share was $21.41 at September 30, 2025, compared to $20.71 at June 30, 2025. Tangible book value per common share (non-GAAP) was $14.13(1) at September 30, 2025, compared to $13.44(1) at June 30, 2025. Book value per common share, as of September 30, 2025, was a record for the Company.
Stock Repurchases and Dividends
During the three-month period ended September 30, 2025, the Company repurchased 350,000 shares of common stock, which equated to a shareholder buyback yield of 0.18%(2). In comparison, during the three-month period ended June 30, 2025, the Company repurchased 1.0 million shares of common stock, which equated to a shareholder buyback yield of 0.49%(2). The Company defines shareholder buyback yield as the percentage of the Company’s market capitalization spent on share repurchases. It reflects how much the Company is returning to the shareholders by reducing the number of outstanding shares, and it is calculated by dividing the Company’s total share repurchase cost for the period by the Company’s total market capitalization at the beginning of the period.
In addition, during the quarter ended September 30, 2025, the Company paid a dividend of $0.20 per share. This cash dividend is consistent with the dividend paid during the second quarter of 2025.
Branches
The Company currently has 75 branches in Arkansas, 78 branches in Florida, 59 branches in Texas, 5 branches in Alabama and one branch in New York City. The Company opened a new branch in San Antonio, Texas during the third quarter of 2025.
Conference Call
Management will conduct a conference call to review this information at 1:00 p.m. CT (2:00 p.m. ET) on Thursday, October 16, 2025. We strongly encourage all participants to pre-register for the conference call webcast or the live call using one of the following links. First, participants can pre-register for the conference call webcast using the following link: https://events.q4inc.com/attendee/934053232. Participants who pre-register will be given a unique webcast link to gain immediate access to the conference call webcast. Second, participants can pre-register for the live call using the following link: https://www.netroadshow.com/events/login/LE9zwo4C7j7DOGxiZMbL6kCGKNc4mh7WFOS. Participants who pre-register will be given the phone number and unique access codes to gain immediate access to the live call. Participants may pre-register now, or at any time prior to the call, and will immediately receive simple instructions via email. The Home BancShares conference call will also be scheduled as an event in your Outlook calendar.
Those without internet access or unable to pre-register may dial in and listen to the live call by calling 1-833-470-1428, Passcode: 549176. A replay of the call will be available by calling 1-866-813-9403, Passcode: 541815, which will be available until October 23, 2025, at 11:59 p.m. CT. Internet access to the call will be available live or in recorded version on the Company's website at www.homebancshares.com.
About Home BancShares
Home BancShares, Inc. is a bank holding company headquartered in Conway, Arkansas. Its wholly-owned subsidiary, Centennial Bank, provides a broad range of commercial and retail banking plus related financial services to businesses, real estate developers, investors, individuals and municipalities. Centennial Bank has branch locations in Arkansas, Florida, Texas, South Alabama and New York City. The Company’s common stock is traded through the New York Stock Exchange under the symbol “HOMB.” The Company was founded in 1998. Visit www.homebancshares.com or www.my100bank.com for more information.
Non-GAAP Financial Measures
This press release contains financial information determined by methods other than in accordance with generally accepted accounting principles (GAAP). The Company’s management uses these non-GAAP financial measures--including net income (earnings), as adjusted; pre-tax, pre-provision, net income (PPNR); PPNR, as adjusted; pre-tax net income, as adjusted, to total revenue (net); pre-tax, pre-provision, profit percentage; pre-tax, pre-provision, profit percentage, as adjusted; diluted earnings per common share, as adjusted; return on average assets, as adjusted; return on average assets excluding intangible amortization; return on average assets, as adjusted, excluding intangible amortization; return on average common equity, as adjusted; return on average tangible common equity; return on average tangible common equity, as adjusted; return on average tangible common equity excluding intangible amortization; return on average tangible common equity, as adjusted, excluding intangible amortization; efficiency ratio, as adjusted; tangible book value per common share and tangible common equity to tangible assets--to provide meaningful supplemental information regarding our performance. These measures typically adjust GAAP performance measures to include the tax benefit associated with revenue items that are tax-exempt, as well as adjust income available to common shareholders for certain significant items or transactions that management believes are not indicative of the Company’s primary business operating results. Since the presentation of these GAAP performance measures and their impact differ between companies, management believes presentations of these non-GAAP financial measures provide useful supplemental information that is essential to a proper understanding of the operating results of the Company’s business. These non-GAAP disclosures should not be viewed as a substitute for operating results determined in accordance with GAAP, nor are they necessarily comparable to non-GAAP performance measures that may be presented by other companies. Where non-GAAP financial measures are used, the comparable GAAP financial measure, as well as the reconciliation to the comparable GAAP financial measure, can be found in the tables of this release.
(1) Calculation of this metric and the reconciliation to GAAP are included in the schedules accompanying this release.
(2) Calculation of this metric is included in the schedules accompanying this release.
General
This release contains forward-looking statements regarding the Company’s plans, expectations, goals and outlook for the future, including future financial results. Statements in this press release that are not historical facts should be considered forward-looking statements within the meaning of the Private Securities Litigation Reform Act of 1995. Forward-looking statements are not guarantees of future events, performance or results. When we use words or phrases like “may,” “plan,” “propose,” “contemplate,” “anticipate,” “believe,” “intend,” “continue,” “expect,” “project,” “predict,” “estimate,” “could,” “should,” “would” and similar expressions, you should consider them as identifying forward-looking statements, although we may use other phrasing. Forward-looking statements of this type speak only as of the date of this news release. By nature, forward-looking statements involve inherent risks and uncertainties. Various factors could cause actual results to differ materially from those contemplated by the forward-looking statements. These factors include, but are not limited to, the following: economic conditions, credit quality, interest rates, loan demand, real estate values and unemployment, including any future impacts from inflation or changes in tariffs or trade policies; the ability to identify, complete and successfully integrate new acquisitions; the risk that expected cost savings and other benefits from acquisitions may not be fully realized or may take longer to realize than expected; diversion of management time on acquisition-related issues; the availability of and access to capital and liquidity on terms acceptable to us; legislative and regulatory changes and risks and expenses associated with current and future legislation and regulations; technological changes and cybersecurity risks and incidents; the effects of changes in accounting policies and practices; changes in governmental monetary and fiscal policies; political instability, military conflicts and other major domestic or international events; the impacts of recent or future adverse weather events, including hurricanes, and other natural disasters; disruptions, uncertainties and related effects on credit quality, liquidity and other aspects of our business and operations that may result from any future public health crises; competition from other financial institutions; potential claims, expenses and other adverse effects related to current or future litigation, regulatory examinations or other government actions; potential increases in deposit insurance assessments, increased regulatory scrutiny or market disruptions resulting from financial challenges in the banking industry; changes in the assumptions used in making the forward-looking statements; and other factors described in reports we file with the Securities and Exchange Commission (the “SEC”), including those factors set forth in our Annual Report on Form 10-K for the year ended December 31, 2024, filed with the SEC on February 27, 2025.
FOR MORE INFORMATION CONTACT:
Donna Townsell
Director of Investor Relations
Home BancShares, Inc.
(501) 328-4625
| Home BancShares, Inc. | ||||||||||||||||||||
| Consolidated End of Period Balance Sheets | ||||||||||||||||||||
| (Unaudited) | ||||||||||||||||||||
| (In thousands) | Sep. 30, 2025 |
Jun. 30, 2025 |
Mar. 31, 2025 |
Dec. 31, 2024 |
Sep. 30, 2024 |
|||||||||||||||
| ASSETS | ||||||||||||||||||||
| Cash and due from banks | $ | 284,750 | $ | 291,344 | $ | 319,747 | $ | 281,063 | $ | 265,408 | ||||||||||
| Interest-bearing deposits with other banks | 516,170 | 809,729 | 975,983 | 629,284 | 752,269 | |||||||||||||||
| Cash and cash equivalents | 800,920 | 1,101,073 | 1,295,730 | 910,347 | 1,017,677 | |||||||||||||||
| Federal funds sold | 3,625 | 2,600 | 6,275 | 3,725 | 6,425 | |||||||||||||||
| Investment securities - available-for-sale, net of allowance for credit losses | 2,924,496 | 2,899,968 | 3,003,320 | 3,072,639 | 3,270,620 | |||||||||||||||
| Investment securities - held-to-maturity, net of allowance for credit losses | 1,264,200 | 1,265,292 | 1,269,896 | 1,275,204 | 1,277,090 | |||||||||||||||
| Total investment securities | 4,188,696 | 4,165,260 | 4,273,216 | 4,347,843 | 4,547,710 | |||||||||||||||
| Loans receivable | 15,285,972 | 15,180,624 | 14,952,116 | 14,764,500 | 14,823,979 | |||||||||||||||
| Allowance for credit losses | (285,649 | ) | (281,869 | ) | (279,944 | ) | (275,880 | ) | (312,574 | ) | ||||||||||
| Loans receivable, net | 15,000,323 | 14,898,755 | 14,672,172 | 14,488,620 | 14,511,405 | |||||||||||||||
| Bank premises and equipment, net | 374,515 | 379,729 | 384,843 | 386,322 | 388,776 | |||||||||||||||
| Foreclosed assets held for sale | 41,263 | 41,529 | 39,680 | 43,407 | 43,040 | |||||||||||||||
| Cash value of life insurance | 219,075 | 218,113 | 221,621 | 219,786 | 219,353 | |||||||||||||||
| Accrued interest receivable | 110,702 | 107,732 | 115,983 | 120,129 | 118,871 | |||||||||||||||
| Deferred tax asset, net | 155,963 | 174,323 | 170,120 | 186,697 | 176,629 | |||||||||||||||
| Goodwill | 1,398,253 | 1,398,253 | 1,398,253 | 1,398,253 | 1,398,253 | |||||||||||||||
| Core deposit intangible | 34,231 | 36,255 | 38,280 | 40,327 | 42,395 | |||||||||||||||
| Other assets | 380,236 | 383,400 | 376,030 | 345,292 | 352,583 | |||||||||||||||
| Total assets | $ | 22,707,802 | $ | 22,907,022 | $ | 22,992,203 | $ | 22,490,748 | $ | 22,823,117 | ||||||||||
| LIABILITIES AND SHAREHOLDERS' EQUITY | ||||||||||||||||||||
| Liabilities | ||||||||||||||||||||
| Deposits: | ||||||||||||||||||||
| Demand and non-interest-bearing | $ | 3,880,101 | $ | 4,024,574 | $ | 4,079,289 | $ | 4,006,115 | $ | 3,937,168 | ||||||||||
| Savings and interest-bearing transaction accounts | 11,500,921 | 11,571,949 | 11,586,106 | 11,347,850 | 10,966,426 | |||||||||||||||
| Time deposits | 1,946,674 | 1,891,909 | 1,876,096 | 1,792,332 | 1,802,116 | |||||||||||||||
| Total deposits | 17,327,696 | 17,488,432 | 17,541,491 | 17,146,297 | 16,705,710 | |||||||||||||||
| Securities sold under agreements to repurchase | 145,998 | 140,813 | 161,401 | 162,350 | 179,416 | |||||||||||||||
| FHLB and other borrowed funds | 550,500 | 550,500 | 600,500 | 600,750 | 1,300,750 | |||||||||||||||
| Accrued interest payable and other liabilities | 189,551 | 203,004 | 207,154 | 181,080 | 238,058 | |||||||||||||||
| Subordinated debentures | 279,093 | 438,957 | 439,102 | 439,246 | 439,394 | |||||||||||||||
| Total liabilities | 18,492,838 | 18,821,706 | 18,949,648 | 18,529,723 | 18,863,328 | |||||||||||||||
| Shareholders' equity | ||||||||||||||||||||
| Common stock | 1,969 | 1,972 | 1,982 | 1,989 | 1,989 | |||||||||||||||
| Capital surplus | 2,214,211 | 2,221,576 | 2,246,312 | 2,272,794 | 2,272,100 | |||||||||||||||
| Retained earnings | 2,181,911 | 2,097,712 | 2,018,801 | 1,942,350 | 1,880,562 | |||||||||||||||
| Accumulated other comprehensive loss | (183,127 | ) | (235,944 | ) | (224,540 | ) | (256,108 | ) | (194,862 | ) | ||||||||||
| Total shareholders' equity | 4,214,964 | 4,085,316 | 4,042,555 | 3,961,025 | 3,959,789 | |||||||||||||||
| Total liabilities and shareholders' equity | $ | 22,707,802 | $ | 22,907,022 | $ | 22,992,203 | $ | 22,490,748 | $ | 22,823,117 | ||||||||||
| Home BancShares, Inc. | ||||||||||||||||||||||||||||
| Consolidated Statements of Income | ||||||||||||||||||||||||||||
| (Unaudited) | ||||||||||||||||||||||||||||
| Quarter Ended | Nine Months Ended | |||||||||||||||||||||||||||
| (In thousands) | Sep. 30, 2025 |
Jun. 30, 2025 |
Mar. 31, 2025 |
Dec. 31, 2024 |
Sep. 30, 2024 |
Sep. 30, 2025 |
Sep. 30, 2024 |
|||||||||||||||||||||
| Interest income: | ||||||||||||||||||||||||||||
| Loans | $ | 283,165 | $ | 276,041 | $ | 270,784 | $ | 278,409 | $ | 281,977 | $ | 829,990 | $ | 821,595 | ||||||||||||||
| Investment securities | ||||||||||||||||||||||||||||
| Taxable | 26,326 | 26,444 | 27,433 | 28,943 | 31,006 | 80,203 | 96,822 | |||||||||||||||||||||
| Tax-exempt | 7,743 | 7,626 | 7,650 | 7,704 | 7,704 | 23,019 | 23,276 | |||||||||||||||||||||
| Deposits - other banks | 6,242 | 8,951 | 6,620 | 7,585 | 12,096 | 21,813 | 35,188 | |||||||||||||||||||||
| Federal funds sold | 56 | 53 | 55 | 73 | 62 | 164 | 182 | |||||||||||||||||||||
| Total interest income | 323,532 | 319,115 | 312,542 | 322,714 | 332,845 | 955,189 | 977,063 | |||||||||||||||||||||
| Interest expense: | ||||||||||||||||||||||||||||
| Interest on deposits | 87,962 | 88,489 | 86,786 | 90,564 | 97,785 | 263,237 | 286,074 | |||||||||||||||||||||
| Federal funds purchased | — | — | — | — | 1 | — | 1 | |||||||||||||||||||||
| FHLB and other borrowed funds | 5,378 | 5,539 | 5,902 | 9,541 | 14,383 | 16,819 | 42,914 | |||||||||||||||||||||
| Securities sold under agreements to repurchase | 1,019 | 1,012 | 1,074 | 1,346 | 1,335 | 3,105 | 4,102 | |||||||||||||||||||||
| Subordinated debentures | 3,007 | 4,123 | 4,124 | 4,121 | 4,121 | 11,254 | 12,340 | |||||||||||||||||||||
| Total interest expense | 97,366 | 99,163 | 97,886 | 105,572 | 117,625 | 294,415 | 345,431 | |||||||||||||||||||||
| Net interest income | 226,166 | 219,952 | 214,656 | 217,142 | 215,220 | 660,774 | 631,632 | |||||||||||||||||||||
| Provision for credit losses on loans | 6,700 | 3,000 | — | 16,700 | 18,200 | 9,700 | 31,700 | |||||||||||||||||||||
| (Recovery of) provision for credit losses on unfunded commitments | (1,000 | ) | — | — | — | 1,000 | (1,000 | ) | — | |||||||||||||||||||
| Recovery of credit losses on investment securities | (2,194 | ) | — | — | — | (330 | ) | (2,194 | ) | (330 | ) | |||||||||||||||||
| Total credit loss expense | 3,506 | 3,000 | — | 16,700 | 18,870 | 6,506 | 31,370 | |||||||||||||||||||||
| Net interest income after credit loss expense | 222,660 | 216,952 | 214,656 | 200,442 | 196,350 | 654,268 | 600,262 | |||||||||||||||||||||
| Non-interest income: | ||||||||||||||||||||||||||||
| Service charges on deposit accounts | 10,486 | 9,552 | 9,650 | 9,935 | 9,888 | 29,688 | 29,288 | |||||||||||||||||||||
| Other service charges and fees | 12,130 | 12,643 | 10,689 | 11,651 | 10,490 | 35,462 | 31,358 | |||||||||||||||||||||
| Trust fees | 4,600 | 5,234 | 4,760 | 4,526 | 4,403 | 14,594 | 14,191 | |||||||||||||||||||||
| Mortgage lending income | 4,691 | 4,780 | 3,599 | 3,518 | 4,437 | 13,070 | 12,271 | |||||||||||||||||||||
| Insurance commissions | 574 | 589 | 535 | 483 | 595 | 1,698 | 1,668 | |||||||||||||||||||||
| Increase in cash value of life insurance | 1,404 | 1,415 | 1,842 | 1,215 | 1,161 | 4,661 | 3,635 | |||||||||||||||||||||
| Dividends from FHLB, FRB, FNBB & other | 2,658 | 2,657 | 2,718 | 2,820 | 2,637 | 8,033 | 8,642 | |||||||||||||||||||||
| Gain on SBA loans | 46 | — | 288 | 218 | 145 | 334 | 399 | |||||||||||||||||||||
| (Loss) gain on branches, equipment and other assets, net | (66 | ) | 972 | (163 | ) | 26 | 32 | 743 | 2,076 | |||||||||||||||||||
| (Loss) gain on OREO, net | (1 | ) | 13 | (376 | ) | (2,423 | ) | 85 | (364 | ) | 151 | |||||||||||||||||
| Fair value adjustment for marketable securities | 1,020 | (238 | ) | 442 | 850 | 1,392 | 1,224 | 2,121 | ||||||||||||||||||||
| Other income | 13,963 | 13,462 | 11,442 | 8,403 | 7,514 | 38,867 | 21,552 | |||||||||||||||||||||
| Total non-interest income | 51,505 | 51,079 | 45,426 | 41,222 | 42,779 | 148,010 | 127,352 | |||||||||||||||||||||
| Non-interest expense: | ||||||||||||||||||||||||||||
| Salaries and employee benefits | 63,804 | 64,318 | 61,855 | 60,824 | 58,861 | 189,977 | 180,198 | |||||||||||||||||||||
| Occupancy and equipment | 14,828 | 14,023 | 14,425 | 14,526 | 14,546 | 43,276 | 43,505 | |||||||||||||||||||||
| Data processing expense | 8,871 | 8,364 | 8,558 | 9,324 | 9,088 | 25,793 | 27,170 | |||||||||||||||||||||
| Other operating expenses | 27,335 | 29,335 | 28,090 | 27,536 | 27,550 | 84,760 | 83,853 | |||||||||||||||||||||
| Total non-interest expense | 114,838 | 116,040 | 112,928 | 112,210 | 110,045 | 343,806 | 334,726 | |||||||||||||||||||||
| Income before income taxes | 159,327 | 151,991 | 147,154 | 129,454 | 129,084 | 458,472 | 392,888 | |||||||||||||||||||||
| Income tax expense | 35,723 | 33,588 | 31,945 | 28,890 | 29,046 | 101,256 | 91,211 | |||||||||||||||||||||
| Net income | $ | 123,604 | $ | 118,403 | $ | 115,209 | $ | 100,564 | $ | 100,038 | $ | 357,216 | $ | 301,677 | ||||||||||||||
| Home BancShares, Inc. | ||||||||||||||||||||||||||||
| Selected Financial Information | ||||||||||||||||||||||||||||
| (Unaudited) | ||||||||||||||||||||||||||||
| Quarter Ended | Nine Months Ended | |||||||||||||||||||||||||||
| (Dollars and shares in thousands, except per share data) | Sep. 30, 2025 |
Jun. 30, 2025 |
Mar. 31, 2025 |
Dec. 31, 2024 |
Sep. 30, 2024 |
Sep. 30, 2025 |
Sep. 30, 2024 |
|||||||||||||||||||||
| PER SHARE DATA | ||||||||||||||||||||||||||||
| Diluted earnings per common share | $ | 0.63 | $ | 0.60 | $ | 0.58 | $ | 0.51 | $ | 0.50 | $ | 1.80 | $ | 1.51 | ||||||||||||||
| Diluted earnings per common share, as adjusted (non-GAAP)(1) | 0.61 | 0.58 | 0.56 | 0.50 | 0.50 | 1.75 | 1.51 | |||||||||||||||||||||
| Basic earnings per common share | 0.63 | 0.60 | 0.58 | 0.51 | 0.50 | 1.81 | 1.51 | |||||||||||||||||||||
| Dividends per share - common | 0.20 | 0.20 | 0.195 | 0.195 | 0.195 | 0.595 | 0.555 | |||||||||||||||||||||
| Shareholder buyback yield(2) | 0.18 | % | 0.49 | % | 0.53 | % | 0.05 | % | 0.56 | % | 1.19 | % | 1.64 | % | ||||||||||||||
| Book value per common share | $ | 21.41 | $ | 20.71 | $ | 20.40 | $ | 19.92 | $ | 19.91 | $ | 21.41 | $ | 19.91 | ||||||||||||||
| Tangible book value per common share (non-GAAP)(1) | 14.13 | 13.44 | 13.15 | 12.68 | 12.67 | 14.13 | 12.67 | |||||||||||||||||||||
| STOCK INFORMATION | ||||||||||||||||||||||||||||
| Average common shares outstanding | 197,078 | 197,532 | 198,657 | 198,863 | 199,380 | 197,750 | 200,300 | |||||||||||||||||||||
| Average diluted shares outstanding | 197,288 | 197,765 | 198,852 | 198,973 | 199,461 | 197,952 | 200,430 | |||||||||||||||||||||
| End of period common shares outstanding | 196,889 | 197,239 | 198,206 | 198,882 | 198,879 | 196,889 | 198,879 | |||||||||||||||||||||
| ANNUALIZED PERFORMANCE METRICS | ||||||||||||||||||||||||||||
| Return on average assets (ROA) | 2.17 | % | 2.08 | % | 2.07 | % | 1.77 | % | 1.74 | % | 2.11 | % | 1.77 | % | ||||||||||||||
| Return on average assets, as adjusted: (ROA, as adjusted) (non-GAAP)(1) | 2.10 | % | 2.02 | % | 2.01 | % | 1.76 | % | 1.72 | % | 2.04 | % | 1.77 | % | ||||||||||||||
| Return on average assets excluding intangible amortization (non-GAAP)(1) | 2.34 | % | 2.25 | % | 2.24 | % | 1.92 | % | 1.88 | % | 2.28 | % | 1.92 | % | ||||||||||||||
| Return on average assets, as adjusted, excluding intangible amortization (non-GAAP)(1) | 2.27 | % | 2.18 | % | 2.18 | % | 1.91 | % | 1.86 | % | 2.21 | % | 1.92 | % | ||||||||||||||
| Return on average common equity (ROE) | 11.91 | % | 11.77 | % | 11.75 | % | 10.13 | % | 10.23 | % | 11.81 | % | 10.53 | % | ||||||||||||||
| Return on average common equity, as adjusted: (ROE, as adjusted) (non-GAAP)(1) | 11.54 | % | 11.39 | % | 11.41 | % | 10.05 | % | 10.12 | % | 11.45 | % | 10.55 | % | ||||||||||||||
| Return on average tangible common equity (ROTCE) (non-GAAP)(1) | 18.28 | % | 18.26 | % | 18.39 | % | 15.94 | % | 16.26 | % | 18.31 | % | 16.91 | % | ||||||||||||||
| Return on average tangible common equity, as adjusted: (ROTCE, as adjusted) (non-GAAP)(1) | 17.70 | % | 17.68 | % | 17.87 | % | 15.82 | % | 16.09 | % | 17.75 | % | 16.94 | % | ||||||||||||||
| Return on average tangible common equity excluding intangible amortization (non-GAAP)(1) | 18.51 | % | 18.50 | % | 18.64 | % | 16.18 | % | 16.51 | % | 18.55 | % | 17.18 | % | ||||||||||||||
| Return on average tangible common equity, as adjusted, excluding intangible amortization (non-GAAP)(1) | 17.93 | % | 17.92 | % | 18.12 | % | 16.07 | % | 16.34 | % | 17.98 | % | 17.20 | % | ||||||||||||||
| (1) Calculation of this metric and the reconciliation to GAAP are included in the schedules accompanying this release. | ||||||||||||||||||||||||||||
| (2) Calculation of this metric is included in the schedules accompanying this release. | ||||||||||||||||||||||||||||
| Home BancShares, Inc. | ||||||||||||||||||||||||||||
| Selected Financial Information | ||||||||||||||||||||||||||||
| (Unaudited) | ||||||||||||||||||||||||||||
| Quarter Ended | Nine Months Ended | |||||||||||||||||||||||||||
| (Dollars in thousands) | Sep. 30, 2025 |
Jun. 30, 2025 |
Mar. 31, 2025 |
Dec. 31, 2024 |
Sep. 30, 2024 |
Sep. 30, 2025 |
Sep. 30, 2024 |
|||||||||||||||||||||
| Efficiency ratio | 40.21 | % | 41.68 | % | 42.22 | % | 42.24 | % | 41.42 | % | 41.35 | % | 42.91 | % | ||||||||||||||
| Efficiency ratio, as adjusted (non-GAAP)(1) | 40.95 | % | 42.01 | % | 42.84 | % | 42.00 | % | 41.66 | % | 41.91 | % | 42.87 | % | ||||||||||||||
| Net interest margin - FTE (NIM) | 4.56 | % | 4.44 | % | 4.44 | % | 4.39 | % | 4.28 | % | 4.48 | % | 4.23 | % | ||||||||||||||
| Fully taxable equivalent adjustment | $ | 2,916 | $ | 2,526 | $ | 2,534 | $ | 2,398 | $ | 2,616 | $ | 7,976 | $ | 6,136 | ||||||||||||||
| Total revenue (net) | 277,671 | 271,031 | 260,082 | 258,364 | 257,999 | 808,784 | 758,984 | |||||||||||||||||||||
| Pre-tax, pre-provision, net income (PPNR) (non-GAAP)(1) | 162,833 | 154,991 | 147,154 | 146,154 | 147,954 | 464,978 | 424,258 | |||||||||||||||||||||
| PPNR, as adjusted (non-GAAP)(1) | 157,704 | 150,404 | 142,821 | 145,209 | 146,562 | 450,929 | 422,176 | |||||||||||||||||||||
| Pre-tax net income to total revenue (net) | 57.38 | % | 56.08 | % | 56.58 | % | 50.11 | % | 50.03 | % | 56.69 | % | 51.76 | % | ||||||||||||||
| Pre-tax net income, as adjusted, to total revenue (net) (non-GAAP)(1) | 55.53 | % | 54.39 | % | 54.91 | % | 49.74 | % | 49.49 | % | 54.95 | % | 51.49 | % | ||||||||||||||
| P5NR (Pre-tax, pre-provision, profit percentage) (PPNR to total revenue (net)) (non-GAAP)(1) | 58.64 | % | 57.19 | % | 56.58 | % | 56.57 | % | 57.35 | % | 57.49 | % | 55.90 | % | ||||||||||||||
| P5NR, as adjusted (non-GAAP)(1) | 56.80 | % | 55.49 | % | 54.91 | % | 56.20 | % | 56.81 | % | 55.75 | % | 55.62 | % | ||||||||||||||
| Total purchase accounting accretion | $ | 1,272 | $ | 1,233 | $ | 1,378 | $ | 1,610 | $ | 1,878 | $ | 3,883 | $ | 6,523 | ||||||||||||||
| Average purchase accounting loan discounts | 15,009 | 16,219 | 17,493 | 19,090 | 20,832 | 16,257 | 22,813 | |||||||||||||||||||||
| OTHER OPERATING EXPENSES | ||||||||||||||||||||||||||||
| Advertising | $ | 2,149 | $ | 2,054 | $ | 1,928 | $ | 1,941 | $ | 1,810 | $ | 6,131 | $ | 5,156 | ||||||||||||||
| Amortization of intangibles | 2,024 | 2,025 | 2,047 | 2,068 | 2,095 | 6,096 | 6,375 | |||||||||||||||||||||
| Electronic banking expense | 3,357 | 3,172 | 3,055 | 3,307 | 3,569 | 9,584 | 10,137 | |||||||||||||||||||||
| Directors' fees | 405 | 431 | 452 | 356 | 362 | 1,288 | 1,283 | |||||||||||||||||||||
| Due from bank service charges | 404 | 283 | 281 | 271 | 302 | 968 | 860 | |||||||||||||||||||||
| FDIC and state assessment | 3,245 | 1,636 | 3,387 | 3,216 | 3,360 | 8,268 | 12,172 | |||||||||||||||||||||
| Insurance | 1,110 | 1,049 | 999 | 900 | 926 | 3,158 | 2,734 | |||||||||||||||||||||
| Legal and accounting | 1,061 | 2,360 | 3,641 | 2,361 | 1,902 | 7,062 | 6,600 | |||||||||||||||||||||
| Other professional fees | 2,083 | 2,211 | 1,947 | 1,736 | 2,062 | 6,241 | 6,406 | |||||||||||||||||||||
| Operating supplies | 773 | 711 | 711 | 711 | 673 | 2,195 | 1,969 | |||||||||||||||||||||
| Postage | 538 | 488 | 503 | 518 | 522 | 1,529 | 1,542 | |||||||||||||||||||||
| Telephone | 367 | 419 | 436 | 438 | 455 | 1,222 | 1,369 | |||||||||||||||||||||
| Other expense | 9,819 | 12,496 | 8,703 | 9,713 | 9,512 | 31,018 | 27,250 | |||||||||||||||||||||
| Total other operating expenses | $ | 27,335 | $ | 29,335 | $ | 28,090 | $ | 27,536 | $ | 27,550 | $ | 84,760 | $ | 83,853 | ||||||||||||||
| (1) Calculation of this metric and the reconciliation to GAAP are included in the schedules accompanying this release. | ||||||||||||||||||||||||||||
| Home BancShares, Inc. | ||||||||||||||||||||
| Selected Financial Information | ||||||||||||||||||||
| (Unaudited) | ||||||||||||||||||||
| (Dollars in thousands) | Sep. 30, 2025 |
Jun. 30, 2025 |
Mar. 31, 2025 |
Dec. 31, 2024 |
Sep. 30, 2024 |
|||||||||||||||
| BALANCE SHEET RATIOS | ||||||||||||||||||||
| Total loans to total deposits | 88.22 | % | 86.80 | % | 85.24 | % | 86.11 | % | 88.74 | % | ||||||||||
| Common equity to assets | 18.56 | % | 17.83 | % | 17.58 | % | 17.61 | % | 17.35 | % | ||||||||||
| Tangible common equity to tangible assets (non-GAAP)(1) | 13.08 | % | 12.35 | % | 12.09 | % | 11.98 | % | 11.78 | % | ||||||||||
| . | ||||||||||||||||||||
| LOANS RECEIVABLE | ||||||||||||||||||||
| Real estate | ||||||||||||||||||||
| Commercial real estate loans | ||||||||||||||||||||
| Non-farm/non-residential | $ | 5,494,492 | $ | 5,553,182 | $ | 5,588,681 | $ | 5,426,780 | $ | 5,496,536 | ||||||||||
| Construction/land development | 2,709,197 | 2,695,561 | 2,735,760 | 2,736,214 | 2,741,419 | |||||||||||||||
| Agricultural | 331,301 | 315,926 | 335,437 | 336,993 | 335,965 | |||||||||||||||
| Residential real estate loans | ||||||||||||||||||||
| Residential 1-4 family | 2,142,375 | 2,138,990 | 1,947,872 | 1,956,489 | 1,932,352 | |||||||||||||||
| Multifamily residential | 716,595 | 620,439 | 576,089 | 496,484 | 482,648 | |||||||||||||||
| Total real estate | 11,393,960 | 11,324,098 | 11,183,839 | 10,952,960 | 10,988,920 | |||||||||||||||
| Consumer | 1,233,523 | 1,218,834 | 1,227,745 | 1,234,361 | 1,219,197 | |||||||||||||||
| Commercial and industrial | 2,100,268 | 2,107,326 | 2,045,036 | 2,022,775 | 2,084,667 | |||||||||||||||
| Agricultural | 346,167 | 323,457 | 314,323 | 367,251 | 352,963 | |||||||||||||||
| Other | 212,054 | 206,909 | 181,173 | 187,153 | 178,232 | |||||||||||||||
| Loans receivable | $ | 15,285,972 | $ | 15,180,624 | $ | 14,952,116 | $ | 14,764,500 | $ | 14,823,979 | ||||||||||
| ALLOWANCE FOR CREDIT LOSSES | ||||||||||||||||||||
| Balance, beginning of period | $ | 281,869 | $ | 279,944 | $ | 275,880 | $ | 312,574 | $ | 295,856 | ||||||||||
| Loans charged off | 4,651 | 4,071 | 3,458 | 53,959 | 2,001 | |||||||||||||||
| Recoveries of loans previously charged off | 1,731 | 2,996 | 7,522 | 565 | 519 | |||||||||||||||
| Net loans charged off (recovered) | 2,920 | 1,075 | (4,064 | ) | 53,394 | 1,482 | ||||||||||||||
| Provision for credit losses - loans | 6,700 | 3,000 | — | 16,700 | 18,200 | |||||||||||||||
| Balance, end of period | $ | 285,649 | $ | 281,869 | $ | 279,944 | $ | 275,880 | $ | 312,574 | ||||||||||
| Net charge-offs (recoveries) to average total loans | 0.08 | % | 0.03 | % | (0.11 | )% | 1.44 | % | 0.04 | % | ||||||||||
| Allowance for credit losses to total loans | 1.87 | % | 1.86 | % | 1.87 | % | 1.87 | % | 2.11 | % | ||||||||||
| NON-PERFORMING ASSETS | ||||||||||||||||||||
| Non-performing loans | ||||||||||||||||||||
| Non-accrual loans | $ | 81,087 | $ | 89,261 | $ | 86,383 | $ | 93,853 | $ | 95,747 | ||||||||||
| Loans past due 90 days or more | 4,125 | 7,031 | 3,264 | 5,034 | 5,356 | |||||||||||||||
| Total non-performing loans | 85,212 | 96,292 | 89,647 | 98,887 | 101,103 | |||||||||||||||
| Other non-performing assets | ||||||||||||||||||||
| Foreclosed assets held for sale, net | 41,263 | 41,529 | 39,680 | 43,407 | 43,040 | |||||||||||||||
| Other non-performing assets | — | — | 63 | 63 | 63 | |||||||||||||||
| Total other non-performing assets | 41,263 | 41,529 | 39,743 | 43,470 | 43,103 | |||||||||||||||
| Total non-performing assets | $ | 126,475 | $ | 137,821 | $ | 129,390 | $ | 142,357 | $ | 144,206 | ||||||||||
| Allowance for credit losses for loans to non-performing loans | 335.22 | % | 292.72 | % | 312.27 | % | 278.99 | % | 309.16 | % | ||||||||||
| Non-performing loans to total loans | 0.56 | % | 0.63 | % | 0.60 | % | 0.67 | % | 0.68 | % | ||||||||||
| Non-performing assets to total assets | 0.56 | % | 0.60 | % | 0.56 | % | 0.63 | % | 0.63 | % | ||||||||||
| (1) Calculation of this metric and the reconciliation to GAAP are included in the schedules accompanying this release. | ||||||||||||||||||||
| Home BancShares, Inc. | ||||||||||||||||||
| Consolidated Net Interest Margin | ||||||||||||||||||
| (Unaudited) | ||||||||||||||||||
| Three Months Ended | ||||||||||||||||||
| September 30, 2025 | June 30, 2025 | |||||||||||||||||
| (Dollars in thousands) | Average Balance |
Income/ Expense |
Yield/ Rate |
Average Balance |
Income/ Expense |
Yield/ Rate |
||||||||||||
| ASSETS | ||||||||||||||||||
| Earning assets | ||||||||||||||||||
| Interest-bearing balances due from banks | $ | 567,617 | $ | 6,242 | 4.36 | % | $ | 813,833 | $ | 8,951 | 4.41 | % | ||||||
| Federal funds sold | 5,142 | 56 | 4.32 | % | 4,878 | 53 | 4.36 | % | ||||||||||
| Investment securities - taxable | 3,039,247 | 26,326 | 3.44 | % | 3,095,764 | 26,444 | 3.43 | % | ||||||||||
| Investment securities - non-taxable - FTE | 1,115,834 | 10,201 | 3.63 | % | 1,113,044 | 10,033 | 3.62 | % | ||||||||||
| Loans receivable - FTE | 15,216,448 | 283,623 | 7.39 | % | 15,055,414 | 276,160 | 7.36 | % | ||||||||||
| Total interest-earning assets | 19,944,288 | 326,448 | 6.49 | % | 20,082,933 | 321,641 | 6.42 | % | ||||||||||
| Non-earning assets | 2,694,650 | 2,714,805 | ||||||||||||||||
| Total assets | $ | 22,638,938 | $ | 22,797,738 | ||||||||||||||
| LIABILITIES AND SHAREHOLDERS' EQUITY | ||||||||||||||||||
| Liabilities | ||||||||||||||||||
| Interest-bearing liabilities | ||||||||||||||||||
| Savings and interest-bearing transaction accounts | $ | 11,408,316 | $ | 70,406 | 2.45 | % | $ | 11,541,641 | $ | 71,042 | 2.47 | % | ||||||
| Time deposits | 1,911,703 | 17,556 | 3.64 | % | 1,886,147 | 17,447 | 3.71 | % | ||||||||||
| Total interest-bearing deposits | 13,320,019 | 87,962 | 2.62 | % | 13,427,788 | 88,489 | 2.64 | % | ||||||||||
| Federal funds purchased | 11 | — | — | % | 46 | — | — | % | ||||||||||
| Securities sold under agreement to repurchase | 145,883 | 1,019 | 2.77 | % | 143,752 | 1,012 | 2.82 | % | ||||||||||
| FHLB and other borrowed funds | 550,501 | 5,378 | 3.88 | % | 566,984 | 5,539 | 3.92 | % | ||||||||||
| Subordinated debentures | 338,757 | 3,007 | 3.52 | % | 439,027 | 4,123 | 3.77 | % | ||||||||||
| Total interest-bearing liabilities | 14,355,171 | 97,366 | 2.69 | % | 14,577,597 | 99,163 | 2.73 | % | ||||||||||
| Non-interest bearing liabilities | ||||||||||||||||||
| Non-interest bearing deposits | 3,956,826 | 3,981,901 | ||||||||||||||||
| Other liabilities | 211,057 | 202,085 | ||||||||||||||||
| Total liabilities | 18,523,054 | 18,761,583 | ||||||||||||||||
| Shareholders' equity | 4,115,884 | 4,036,155 | ||||||||||||||||
| Total liabilities and shareholders' equity | $ | 22,638,938 | $ | 22,797,738 | ||||||||||||||
| Net interest spread | 3.80 | % | 3.69 | % | ||||||||||||||
| Net interest income and margin - FTE | $ | 229,082 | 4.56 | % | $ | 222,478 | 4.44 | % | ||||||||||
| Home BancShares, Inc. | ||||||||||||||||||
| Consolidated Net Interest Margin | ||||||||||||||||||
| (Unaudited) | ||||||||||||||||||
| Nine Months Ended | ||||||||||||||||||
| September 30, 2025 | September 30, 2024 | |||||||||||||||||
| (Dollars in thousands) | Average Balance |
Income/ Expense |
Yield/ Rate |
Average Balance |
Income/ Expense |
Yield/ Rate |
||||||||||||
| ASSETS | ||||||||||||||||||
| Earning assets | ||||||||||||||||||
| Interest-bearing balances due from banks | $ | 664,308 | $ | 21,813 | 4.39 | % | $ | 878,368 | $ | 35,188 | 5.35 | % | ||||||
| Federal funds sold | 5,037 | 164 | 4.35 | % | 4,688 | 182 | 5.19 | % | ||||||||||
| Investment securities - taxable | 3,104,254 | 80,203 | 3.45 | % | 3,436,874 | 96,822 | 3.76 | % | ||||||||||
| Investment securities - non-taxable - FTE | 1,121,481 | 30,294 | 3.61 | % | 1,202,003 | 29,077 | 3.23 | % | ||||||||||
| Loans receivable - FTE | 15,056,440 | 830,691 | 7.38 | % | 14,633,382 | 821,930 | 7.50 | % | ||||||||||
| Total interest-earning assets | 19,951,520 | 963,165 | 6.45 | % | 20,155,315 | 983,199 | 6.52 | % | ||||||||||
| Non-earning assets | 2,710,647 | 2,662,627 | ||||||||||||||||
| Total assets | $ | 22,662,167 | $ | 22,817,942 | ||||||||||||||
| LIABILITIES AND SHAREHOLDERS' EQUITY | ||||||||||||||||||
| Liabilities | ||||||||||||||||||
| Interest-bearing liabilities | ||||||||||||||||||
| Savings and interest-bearing transaction accounts | $ | 11,450,902 | $ | 211,120 | 2.47 | % | $ | 11,084,397 | $ | 232,757 | 2.80 | % | ||||||
| Time deposits | 1,866,855 | 52,117 | 3.73 | % | 1,729,400 | 53,317 | 4.12 | % | ||||||||||
| Total interest-bearing deposits | 13,317,757 | 263,237 | 2.64 | % | 12,813,797 | 286,074 | 2.98 | % | ||||||||||
| Federal funds purchased | 19 | — | — | % | 26 | 1 | 5.14 | % | ||||||||||
| Securities sold under agreement to repurchase | 148,462 | 3,105 | 2.80 | % | 163,013 | 4,102 | 3.36 | % | ||||||||||
| FHLB and other borrowed funds | 572,538 | 16,819 | 3.93 | % | 1,301,005 | 42,914 | 4.41 | % | ||||||||||
| Subordinated debentures | 405,285 | 11,254 | 3.71 | % | 439,613 | 12,340 | 3.75 | % | ||||||||||
| Total interest-bearing liabilities | 14,444,061 | 294,415 | 2.73 | % | 14,717,454 | 345,431 | 3.14 | % | ||||||||||
| Non-interest bearing liabilities | ||||||||||||||||||
| Non-interest bearing deposits | 3,973,135 | 4,031,447 | ||||||||||||||||
| Other liabilities | 201,228 | 242,422 | ||||||||||||||||
| Total liabilities | 18,618,424 | 18,991,323 | ||||||||||||||||
| Shareholders' equity | 4,043,743 | 3,826,619 | ||||||||||||||||
| Total liabilities and shareholders' equity | $ | 22,662,167 | $ | 22,817,942 | ||||||||||||||
| Net interest spread | 3.72 | % | 3.38 | % | ||||||||||||||
| Net interest income and margin - FTE | $ | 668,750 | 4.48 | % | $ | 637,768 | 4.23 | % | ||||||||||
| Home BancShares, Inc. | ||||||||||||||||||||||||||||
| Non-GAAP Reconciliations | ||||||||||||||||||||||||||||
| (Unaudited) | ||||||||||||||||||||||||||||
| Quarter Ended | Nine Months Ended | |||||||||||||||||||||||||||
| (Dollars and shares in thousands, except per share data) | Sep. 30, 2025 |
Jun. 30, 2025 |
Mar. 31, 2025 |
Dec. 31, 2024 |
Sep. 30, 2024 |
Sep. 30, 2025 |
Sep. 30, 2024 |
|||||||||||||||||||||
| EARNINGS, AS ADJUSTED | ||||||||||||||||||||||||||||
| GAAP net income available to common shareholders (A) | $ | 123,604 | $ | 118,403 | $ | 115,209 | $ | 100,564 | $ | 100,038 | $ | 357,216 | $ | 301,677 | ||||||||||||||
| Pre-tax adjustments | ||||||||||||||||||||||||||||
| Gain on retirement of subordinated debt | (1,882 | ) | — | — | — | — | (1,882 | ) | — | |||||||||||||||||||
| FDIC special assessment | — | (1,516 | ) | — | — | — | (1,516 | ) | 2,260 | |||||||||||||||||||
| BOLI death benefits | (187 | ) | (1,243 | ) | — | (95 | ) | — | (1,430 | ) | (162 | ) | ||||||||||||||||
| Gain on sale of premises and equipment | — | (983 | ) | — | — | — | (983 | ) | (2,059 | ) | ||||||||||||||||||
| Fair value adjustment for marketable securities | (1,020 | ) | 238 | (442 | ) | (850 | ) | (1,392 | ) | (1,224 | ) | (2,121 | ) | |||||||||||||||
| Special income from equity investment | — | (3,498 | ) | (3,891 | ) | — | — | (7,389 | ) | — | ||||||||||||||||||
| Legal fee reimbursement | — | (885 | ) | — | — | — | (885 | ) | — | |||||||||||||||||||
| Legal claims expense | — | 3,300 | — | — | — | 3,300 | — | |||||||||||||||||||||
| Recoveries on historic losses | (2,040 | ) | — | — | — | — | (2,040 | ) | — | |||||||||||||||||||
| Total pre-tax adjustments | (5,129 | ) | (4,587 | ) | (4,333 | ) | (945 | ) | (1,392 | ) | (14,049 | ) | (2,082 | ) | ||||||||||||||
| Tax-effect of adjustments | (1,207 | ) | (817 | ) | (1,059 | ) | (208 | ) | (348 | ) | (3,083 | ) | (480 | ) | ||||||||||||||
| Deferred tax asset write-down | — | — | — | — | — | — | 2,030 | |||||||||||||||||||||
| Total adjustments after-tax (B) | (3,922 | ) | (3,770 | ) | (3,274 | ) | (737 | ) | (1,044 | ) | (10,966 | ) | 428 | |||||||||||||||
| Earnings, as adjusted (C) | $ | 119,682 | $ | 114,633 | $ | 111,935 | $ | 99,827 | $ | 98,994 | $ | 346,250 | $ | 302,105 | ||||||||||||||
| Average diluted shares outstanding (D) | 197,288 | 197,765 | 198,852 | 198,973 | 199,461 | 197,952 | 200,430 | |||||||||||||||||||||
| GAAP diluted earnings per share: (A/D) | $ | 0.63 | $ | 0.60 | $ | 0.58 | $ | 0.51 | $ | 0.50 | $ | 1.80 | $ | 1.51 | ||||||||||||||
| Adjustments after-tax: (B/D) | (0.02 | ) | (0.02 | ) | (0.02 | ) | (0.01 | ) | 0.00 | (0.05 | ) | 0.00 | ||||||||||||||||
| Diluted earnings per common share, as adjusted: (C/D) | $ | 0.61 | $ | 0.58 | $ | 0.56 | $ | 0.50 | $ | 0.50 | $ | 1.75 | $ | 1.51 | ||||||||||||||
| ANNUALIZED RETURN ON AVERAGE ASSETS | ||||||||||||||||||||||||||||
| Return on average assets: (A/E) | 2.17 | % | 2.08 | % | 2.07 | % | 1.77 | % | 1.74 | % | 2.11 | % | 1.77 | % | ||||||||||||||
| Return on average assets, as adjusted: (ROA, as adjusted) ((A+D)/E) | 2.10 | % | 2.02 | % | 2.01 | % | 1.76 | % | 1.72 | % | 2.04 | % | 1.77 | % | ||||||||||||||
| Return on average assets excluding intangible amortization: ((A+C)/(E-F)) | 2.34 | % | 2.25 | % | 2.24 | % | 1.92 | % | 1.88 | % | 2.28 | % | 1.92 | % | ||||||||||||||
| Return on average assets, as adjusted, excluding intangible amortization: ((A+C+D)/(E-F)) | 2.27 | % | 2.18 | % | 2.18 | % | 1.91 | % | 1.86 | % | 2.21 | % | 1.92 | % | ||||||||||||||
| GAAP net income available to common shareholders (A) | $ | 123,604 | $ | 118,403 | $ | 115,209 | $ | 100,564 | $ | 100,038 | $ | 357,216 | $ | 301,677 | ||||||||||||||
| Amortization of intangibles (B) | 2,024 | 2,025 | 2,047 | 2,068 | 2,095 | 6,096 | 6,375 | |||||||||||||||||||||
| Amortization of intangibles after-tax (C) | 1,529 | 1,530 | 1,547 | 1,563 | 1,572 | 4,607 | 4,782 | |||||||||||||||||||||
| Adjustments after-tax (D) | (3,922 | ) | (3,770 | ) | (3,274 | ) | (737 | ) | (1,044 | ) | (10,966 | ) | 428 | |||||||||||||||
| Average assets (E) | 22,638,938 | 22,797,738 | 22,548,835 | 22,565,077 | 22,893,784 | 22,662,167 | 22,817,942 | |||||||||||||||||||||
| Average goodwill & core deposit intangible (F) | 1,433,474 | 1,435,480 | 1,437,515 | 1,439,566 | 1,441,654 | 1,435,475 | 1,443,770 | |||||||||||||||||||||
| Home BancShares, Inc. | ||||||||||||||||||||||||||||
| Non-GAAP Reconciliations | ||||||||||||||||||||||||||||
| (Unaudited) | ||||||||||||||||||||||||||||
| Quarter Ended | Nine Months Ended | |||||||||||||||||||||||||||
| (Dollars in thousands) | Sep. 30, 2025 |
Jun. 30, 2025 |
Mar. 31, 2025 |
Dec. 31, 2024 |
Sep. 30, 2024 |
Sep. 30, 2025 |
Sep. 30, 2024 |
|||||||||||||||||||||
| ANNUALIZED RETURN ON AVERAGE COMMON EQUITY | ||||||||||||||||||||||||||||
| Return on average common equity: (A/D) | 11.91 | % | 11.77 | % | 11.75 | % | 10.13 | % | 10.23 | % | 11.81 | % | 10.53 | % | ||||||||||||||
| Return on average common equity, as adjusted: (ROE, as adjusted) ((A+C)/D) | 11.54 | % | 11.39 | % | 11.41 | % | 10.05 | % | 10.12 | % | 11.45 | % | 10.55 | % | ||||||||||||||
| Return on average tangible common equity: (ROTCE) (A/(D-E)) | 18.28 | % | 18.26 | % | 18.39 | % | 15.94 | % | 16.26 | % | 18.31 | % | 16.91 | % | ||||||||||||||
| Return on average tangible common equity, as adjusted: (ROTCE, as adjusted) ((A+C)/(D-E)) | 17.70 | % | 17.68 | % | 17.87 | % | 15.82 | % | 16.09 | % | 17.75 | % | 16.94 | % | ||||||||||||||
| Return on average tangible common equity excluding intangible amortization: (B/(D-E)) | 18.51 | % | 18.50 | % | 18.64 | % | 16.18 | % | 16.51 | % | 18.55 | % | 17.18 | % | ||||||||||||||
| Return on average tangible common equity, as adjusted, excluding intangible amortization: ((B+C)/(D-E)) | 17.93 | % | 17.92 | % | 18.12 | % | 16.07 | % | 16.34 | % | 17.98 | % | 17.20 | % | ||||||||||||||
| GAAP net income available to common shareholders (A) | $ | 123,604 | $ | 118,403 | $ | 115,209 | $ | 100,564 | $ | 100,038 | $ | 357,216 | $ | 301,677 | ||||||||||||||
| Earnings excluding intangible amortization (B) | 125,133 | 119,933 | 116,756 | 102,127 | 101,610 | 361,823 | 306,459 | |||||||||||||||||||||
| Adjustments after-tax (C) | (3,922 | ) | (3,770 | ) | (3,274 | ) | (737 | ) | (1,044 | ) | (10,966 | ) | 428 | |||||||||||||||
| Average common equity (D) | 4,115,884 | 4,036,155 | 3,977,671 | 3,950,176 | 3,889,712 | 4,043,743 | 3,826,619 | |||||||||||||||||||||
| Average goodwill & core deposits intangible (E) | 1,433,474 | 1,435,480 | 1,437,515 | 1,439,566 | 1,441,654 | 1,435,475 | 1,443,770 | |||||||||||||||||||||
| EFFICIENCY RATIO & P5NR | ||||||||||||||||||||||||||||
| Efficiency ratio: ((D-G)/(B+C+E)) | 40.21 | % | 41.68 | % | 42.22 | % | 42.24 | % | 41.42 | % | 41.35 | % | 42.91 | % | ||||||||||||||
| Efficiency ratio, as adjusted: ((D-G-I)/(B+C+E-H)) | 40.95 | % | 42.01 | % | 42.84 | % | 42.00 | % | 41.66 | % | 41.91 | % | 42.87 | % | ||||||||||||||
| Pre-tax net income to total revenue (net) (A/(B+C)) | 57.38 | % | 56.08 | % | 56.58 | % | 50.11 | % | 50.03 | % | 56.69 | % | 51.76 | % | ||||||||||||||
| Pre-tax net income, as adjusted, to total revenue (net) ((A+F)/(B+C)) | 55.53 | % | 54.39 | % | 54.91 | % | 49.74 | % | 49.49 | % | 54.95 | % | 51.49 | % | ||||||||||||||
| Pre-tax, pre-provision, net income (PPNR) (B+C-D) | $ | 162,833 | $ | 154,991 | $ | 147,154 | $ | 146,154 | $ | 147,954 | $ | 464,978 | $ | 424,258 | ||||||||||||||
| Pre-tax, pre-provision, net income, as adjusted (B+C-D+F) | $ | 157,704 | $ | 150,404 | $ | 142,821 | $ | 145,209 | $ | 146,562 | $ | 450,929 | $ | 422,176 | ||||||||||||||
| P5NR (Pre-tax, pre-provision, profit percentage) PPNR to total revenue (net)) (B+C-D)/(B+C) | 58.64 | % | 57.19 | % | 56.58 | % | 56.57 | % | 57.35 | % | 57.49 | % | 55.90 | % | ||||||||||||||
| P5NR, as adjusted (B+C-D+F)/(B+C) | 56.80 | % | 55.49 | % | 54.91 | % | 56.20 | % | 56.81 | % | 55.75 | % | 55.62 | % | ||||||||||||||
| Pre-tax net income (A) | $ | 159,327 | $ | 151,991 | $ | 147,154 | $ | 129,454 | $ | 129,084 | $ | 458,472 | $ | 392,888 | ||||||||||||||
| Net interest income (B) | 226,166 | 219,952 | 214,656 | 217,142 | 215,220 | 660,774 | 631,632 | |||||||||||||||||||||
| Non-interest income (C) | 51,505 | 51,079 | 45,426 | 41,222 | 42,779 | 148,010 | 127,352 | |||||||||||||||||||||
| Non-interest expense (D) | 114,838 | 116,040 | 112,928 | 112,210 | 110,045 | 343,806 | 334,726 | |||||||||||||||||||||
| Fully taxable equivalent adjustment (E) | 2,916 | 2,526 | 2,534 | 2,398 | 2,616 | 7,976 | 6,136 | |||||||||||||||||||||
| Total pre-tax adjustments (F) | (5,129 | ) | (4,587 | ) | (4,333 | ) | (945 | ) | (1,392 | ) | (14,049 | ) | (2,082 | ) | ||||||||||||||
| Amortization of intangibles (G) | 2,024 | 2,025 | 2,047 | 2,068 | 2,095 | 6,096 | 6,375 | |||||||||||||||||||||
| Adjustments: | ||||||||||||||||||||||||||||
| Non-interest income: | ||||||||||||||||||||||||||||
| Gain on retirement of subordinated debt | $ | 1,882 | $ | — | $ | — | $ | — | $ | — | $ | 1,882 | $ | — | ||||||||||||||
| Fair value adjustment for marketable securities | 1,020 | (238 | ) | 442 | 850 | 1,392 | 1,224 | 2,121 | ||||||||||||||||||||
| (Loss) gain on OREO | (1 | ) | 13 | (376 | ) | (2,423 | ) | 85 | (364 | ) | 151 | |||||||||||||||||
| (Loss) gain on branches, equipment and other assets, net | (66 | ) | 972 | (163 | ) | 26 | 32 | 743 | 2,076 | |||||||||||||||||||
| Special income from equity investment | — | 3,498 | 3,891 | — | — | 7,389 | — | |||||||||||||||||||||
| BOLI death benefits | 187 | 1,243 | — | 95 | — | 1,430 | 162 | |||||||||||||||||||||
| Legal expense reimbursement | — | 885 | — | — | — | 885 | — | |||||||||||||||||||||
| Recoveries on historic losses | 2,040 | — | — | — | — | 2,040 | — | |||||||||||||||||||||
| Total non-interest income adjustments (H) | $ | 5,062 | $ | 6,373 | $ | 3,794 | $ | (1,452 | ) | $ | 1,509 | $ | 15,229 | $ | 4,510 | |||||||||||||
| Non-interest expense: | ||||||||||||||||||||||||||||
| FDIC special assessment | — | (1,516 | ) | — | — | — | (1,516 | ) | 2,260 | |||||||||||||||||||
| Legal claims expense | — | 3,300 | — | — | — | 3,300 | — | |||||||||||||||||||||
| Total non-interest expense adjustments (I) | $ | — | $ | 1,784 | $ | — | $ | — | $ | — | $ | 1,784 | $ | 2,260 | ||||||||||||||
| Home BancShares, Inc. | ||||||||||||||||||||
| Non-GAAP Reconciliations | ||||||||||||||||||||
| (Unaudited) | ||||||||||||||||||||
| Quarter Ended | ||||||||||||||||||||
| Sep. 30, 2025 |
Jun. 30, 2025 |
Mar. 31, 2025 |
Dec. 31, 2024 |
Sep. 30, 2024 |
||||||||||||||||
| TANGIBLE BOOK VALUE PER COMMON SHARE | ||||||||||||||||||||
| Book value per common share: (A/B) | $ | 21.41 | $ | 20.71 | $ | 20.40 | $ | 19.92 | $ | 19.91 | ||||||||||
| Tangible book value per common share: ((A-C-D)/B) | 14.13 | 13.44 | 13.15 | 12.68 | 12.67 | |||||||||||||||
| Total shareholders' equity (A) | $ | 4,214,964 | $ | 4,085,316 | $ | 4,042,555 | $ | 3,961,025 | $ | 3,959,789 | ||||||||||
| End of period common shares outstanding (B) | 196,889 | 197,239 | 198,206 | 198,882 | 198,879 | |||||||||||||||
| Goodwill (C) | 1,398,253 | 1,398,253 | 1,398,253 | 1,398,253 | 1,398,253 | |||||||||||||||
| Core deposit and other intangibles (D) | 34,231 | 36,255 | 38,280 | 40,327 | 42,395 | |||||||||||||||
| TANGIBLE COMMON EQUITY TO TANGIBLE ASSETS | ||||||||||||||||||||
| Equity to assets: (B/A) | 18.56 | % | 17.83 | % | 17.58 | % | 17.61 | % | 17.35 | % | ||||||||||
| Tangible common equity to tangible assets: ((B-C-D)/(A-C-D)) | 13.08 | % | 12.35 | % | 12.09 | % | 11.98 | % | 11.78 | % | ||||||||||
| Total assets (A) | $ | 22,707,802 | $ | 22,907,022 | $ | 22,992,203 | $ | 22,490,748 | $ | 22,823,117 | ||||||||||
| Total shareholders' equity (B) | 4,214,964 | 4,085,316 | 4,042,555 | 3,961,025 | 3,959,789 | |||||||||||||||
| Goodwill (C) | 1,398,253 | 1,398,253 | 1,398,253 | 1,398,253 | 1,398,253 | |||||||||||||||
| Core deposit and other intangibles (D) | 34,231 | 36,255 | 38,280 | 40,327 | 42,395 | |||||||||||||||
| Home BancShares, Inc. | ||||||||||||||||||||||||||||
| Shareholder Buyback Yield | ||||||||||||||||||||||||||||
| (Unaudited) | ||||||||||||||||||||||||||||
| Quarter Ended | Nine Months Ended | |||||||||||||||||||||||||||
| (Dollars and shares in thousands) | Sep. 30, 2025 |
Jun. 30, 2025 |
Mar. 31, 2025 |
Dec. 31, 2024 |
Sep. 30, 2024 |
Sep. 30, 2025 |
Sep. 30, 2024 |
|||||||||||||||||||||
| SHAREHOLDER BUYBACK YIELD | ||||||||||||||||||||||||||||
| Shareholder buyback yield: (A/B) | 0.18 | % | 0.49 | % | 0.53 | % | 0.05 | % | 0.56 | % | 1.19 | % | 1.64 | % | ||||||||||||||
| Shares repurchased | 350 | 1,000 | 1,000 | 96 | 1,000 | 2,350 | 3,426 | |||||||||||||||||||||
| Average price per share | $ | 28.34 | $ | 26.99 | $ | 29.67 | $ | 26.38 | $ | 26.90 | $ | 28.33 | $ | 24.36 | ||||||||||||||
| Principal cost | 9,918 | 26,989 | 29,668 | 2,526 | 26,902 | 66,575 | 83,450 | |||||||||||||||||||||
| Excise tax | 93 | 459 | 117 | (72 | ) | 63 | 669 | 484 | ||||||||||||||||||||
| Total share repurchase cost (A) | $ | 10,011 | $ | 27,448 | $ | 29,785 | $ | 2,454 | $ | 26,965 | $ | 67,244 | $ | 83,934 | ||||||||||||||
| Shares outstanding beginning of period | 197,239 | 198,206 | 198,882 | 198,879 | 199,746 | 198,882 | 201,526 | |||||||||||||||||||||
| Price per share beginning of period | $ | 28.46 | $ | 28.27 | $ | 28.30 | $ | 27.09 | $ | 23.96 | $ | 28.30 | $ | 25.33 | ||||||||||||||
| Market capitalization beginning of period (B) | $ | 5,613,422 | $ | 5,603,284 | $ | 5,628,361 | $ | 5,387,632 | $ | 4,785,914 | $ | 5,628,361 | $ | 5,104,654 | ||||||||||||||
Photos accompanying this announcement are available at
https://www.globenewswire.com/NewsRoom/AttachmentNg/8fdb9efb-85ac-4fce-8956-d07f19f86954
https://www.globenewswire.com/NewsRoom/AttachmentNg/1344bbc9-601a-4ada-ba2a-0e20af2c7b2e
https://www.globenewswire.com/NewsRoom/AttachmentNg/d9c924c2-29e5-4a4c-95e8-49d9f1d8bec8
https://www.globenewswire.com/NewsRoom/AttachmentNg/efe0258b-31d0-478c-87af-f5c34aa123da
https://www.globenewswire.com/NewsRoom/AttachmentNg/f378b78e-46a8-4a98-a05e-c55d294208a6
https://www.globenewswire.com/NewsRoom/AttachmentNg/e99055ee-cf6a-4d6b-b37f-c20900cbf5ea


Net Income (in thousands)
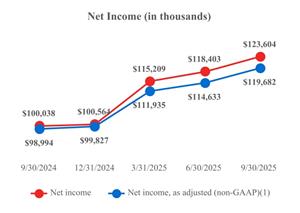
Net income: 5 quarter trend
Pre-Tax, Pre-Provision, Net Income (PPNR) (Non-GAAP)(1) (in thousands)
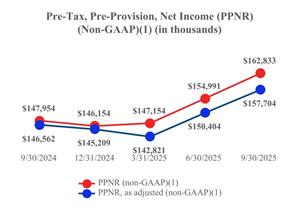
PPNR and PPNR, as adjusted (non-GAAP): 5 quarter trend
Return on Average Assets (ROA)
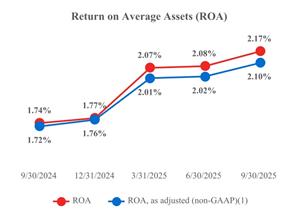
ROA and ROA, as adjusted (non-GAAP): 5 quarter trend.
Efficiency Ratio
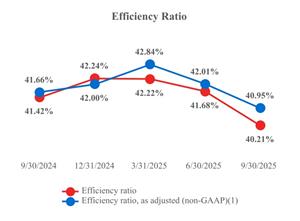
Efficiency ratio: 5 quarter trend
Net Interest Margin (NIM)
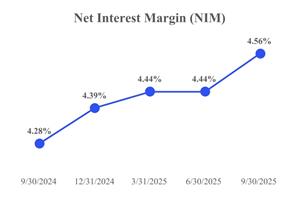
NIM: 5 quarter trend
NIM Yields/Rates
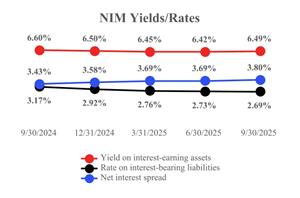
Yield on interest-earning assets, rate on interest-bearing liabilities and net interest spread: 5 quarter trend
Legal Disclaimer:
EIN Presswire provides this news content "as is" without warranty of any kind. We do not accept any responsibility or liability for the accuracy, content, images, videos, licenses, completeness, legality, or reliability of the information contained in this article. If you have any complaints or copyright issues related to this article, kindly contact the author above.
